It was August 8th, 2019, the dog days of summer. Giancarlo Stanton dug into the batter’s box and did what Giancarlo Stanton does: He hit a moonshot. With the Yanks up 5-3 in the bottom of the 5th, Ariel Jurado delivered a 91 MPH two-seam fastball that Stanton promptly deposited 450-feet from home plate and into the left-field seats. That 91 MPH pitch? He hit it 121.7 MPH; if you’d looked away for a couple of seconds, you probably missed it.
For the vast majority of baseball’s history, there was no way to record exit velocity accurately. Sadly, we’ll never know for sure how hard Babe Ruth, Mickey Mantle, or Hank Aaron could hammer the ball. But, since its implementation in 2015, MLB’s Statcast has changed the game. A batter’s swing strength is no longer an enigma or a subjective argument between opposing fanbases, but now an objective number calculated after every batted ball. We know the speed with which balls explode off the bat of Pete Alonso or Aaron Judge. We also know the three hardest-hit balls of the Statcast era belong to Giancarlo Stanton, the de facto king of exit velocity. The laser hit that August night was the hardest-hit home run ever recorded.
As fans of baseball, we’re often enthralled by the extremes. We love discussing who runs the fastest, who has the best glove, who has the most power—who hit the hardest batted ball, or had the highest maximum exit velocity (max EV). In the weeks following the 2020 World Series, Twitter has developed a particular fascination with max EV; even Jason Ochart, Phillies Minor League Hitting Coordinator and Director of Hitting for Driveline Baseball, went out of his way to display its relationship with the best hitters in the game:
He’s right; hitting the ball hard is good. Of course, it is. Bat speed is good, mostly because it leads to hitting the ball harder. Max EV certainly does a great job revealing a given player’s top-end bat speed, as Ochart mentions in his Twitter thread. But, all of this max EV talk fails to mention what kinds of players are achieving these beastly EVs. Stanton (there he is again), Alonso, Sanchez, Vlad, Robert, Sano, Franmil, etc. are among the largest and strongest in MLB. Even among professional baseball players, they’re comparatively enormous. Can, and should, every player practice to get on this list? Consider this: Jo Adell is in the top 20. While the Angels’ top prospect likely has a bright future ahead, he finished in the bottom percentile of players in expected batting average and second percentile of players in expected slugging. Take a look:
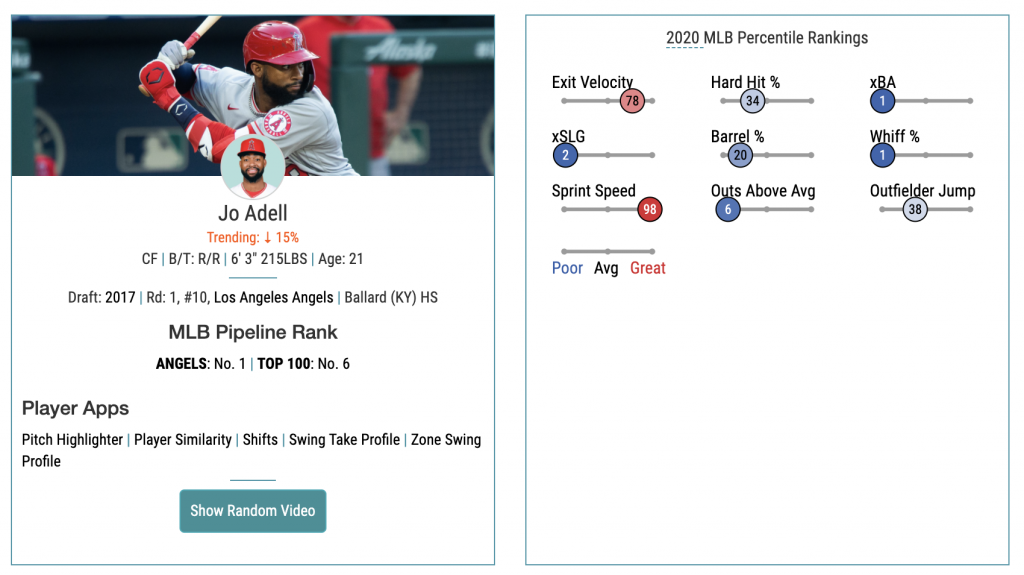
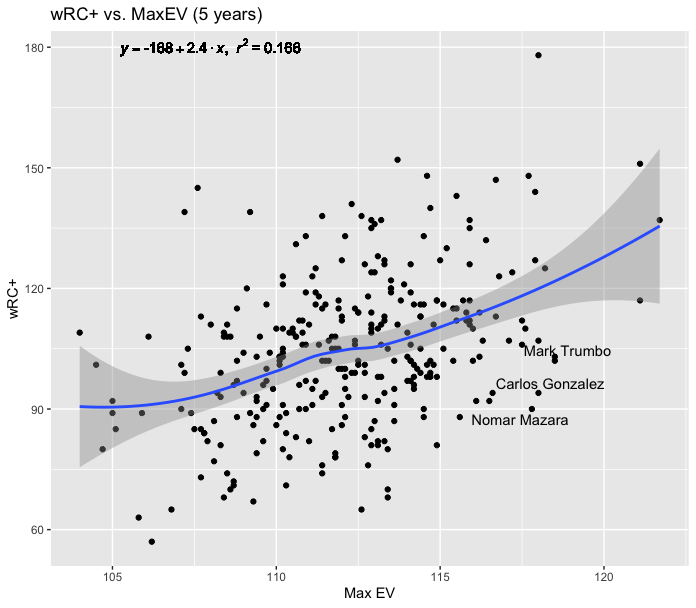
Suffice it to say that’s very poor. It’s also important to keep in mind that max EV is one data point. We see outliers in data all the time and, yes, while most of the players with top max EVs are great power hitters, there are inevitably going to be some players who appear at or near the top of the list because they hit one ball exceptionally well. The linear regression below is a plot of wRC+ (from FanGraphs) vs. max EV for qualified hitters over the last five years (2016-2020). Sure, you’ll find familiar names like Giancarlo Stanton (I know, I’m tired of mentioning him too), Aaron Judge, and Joey Gallo in the top 20. But, you’ll also find Hanley Ramirez (106 wRC+), Avisail García (107 wRC+), and Nomar Mazara (90 wRC+) there. Mark Trumbo (102 wRC+) and Tyler Flowers (103 wRC+) are in the top 5. I wouldn’t exactly call that a murderer’s row of the past half-decade.
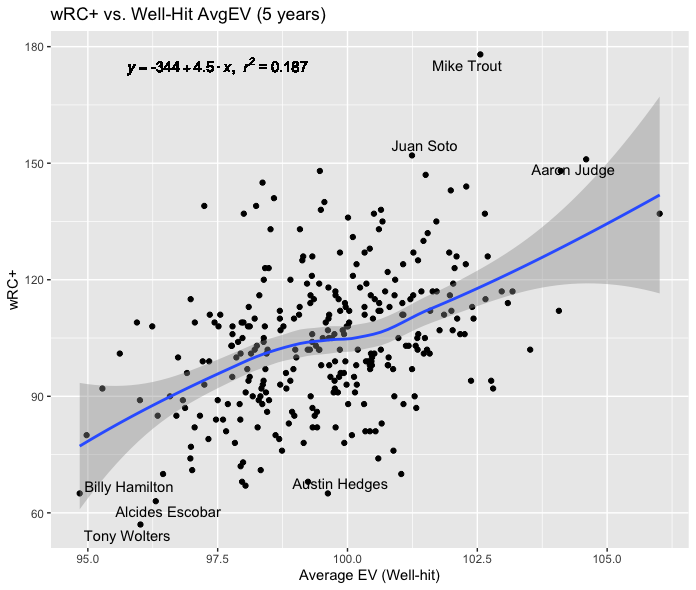
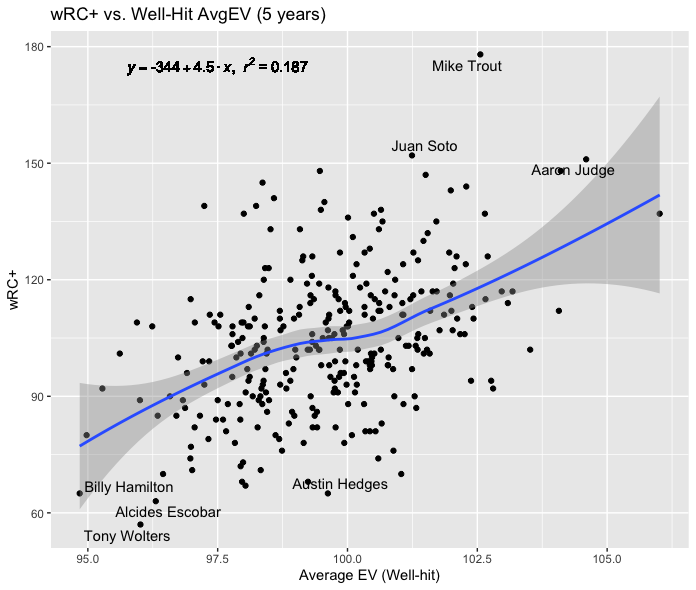
It all begs the question: How much does max EV matter? And which, if any, EV metrics are superior to max EV? Well, I set out to find the answers. I began by scraping Baseball Savant data for every batted ball since 2016. Hoping to discover whether there was a difference in EV metrics’ predictiveness over time, I looked at three different versions of EV: Max EV, Average EV, and “Well-Hit” Average EV. The thought process was that if I filter the data by “well-hit” balls, then I would exclude badly mishit balls and create a metric with more consistency. Rather than significantly alter the data, the standards I used for well-hit balls were relatively low: any ball with an EV greater than 90 MPH and a launch angle between -10 degrees and 45 degrees. After filtering the data, I calculated the well-hit average EVs for each player for each year, then the same for three (2018-2020) and five years (2016-2020). With the well-hit EVs calculated, I regressed the data against the most comprehensive offensive stat available, wRC+, as reported by FanGraphs. Then, I did the same with each player’s unfiltered average EV and max EV. While I expected max EV to be the winner in the short-term and well-hit EV the winner in the long-term, the results surprised me.
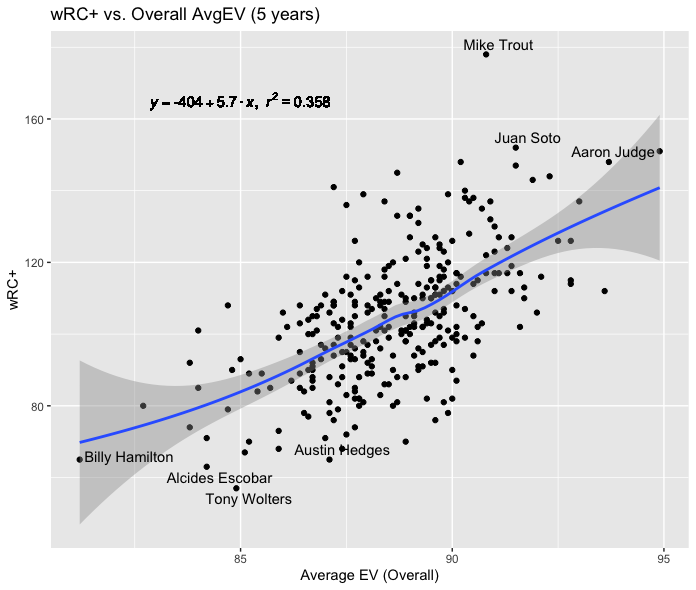
The previous graphs portray each of the three EV stats regressed against wRC+ over the five years of 2016-2020—the more linear the graph, the stronger the relationship between the two variables. As you can see, overall average EV showed the strongest relationship with offensive success, followed by well-hit average EV, and then max EV displaying the weakest correlation—the R-squared values for each plot confirm this.
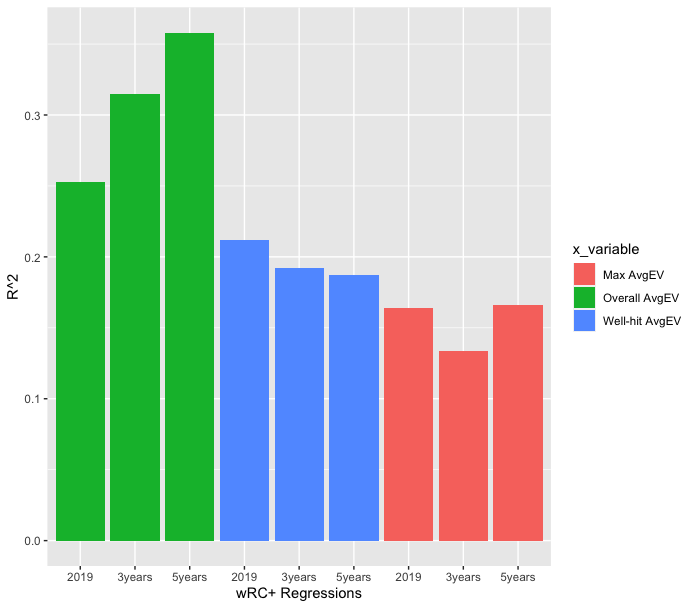
The chart above depicts the R-squared values for regressions of each EV metric against wRC+ for periods of one, three, and five years. For those unfamiliar with R-squared, the number is essentially the percentage of change in y (wRC+ in this case) that can be explained by a change in x (EV). In other words, for the five-year period, about 36% of the change in a player’s wRC+ could be attributed to a change in overall average EV.
Regardless of the time frame, both overall average EV and well-hit EV outperformed max EV by a wide margin. Interestingly, and even though I calculated well-hit EV as a “better version” of average EV, the average EV seemed to be a better predictor of performance than its well-hit counterpart. Initially, I didn’t understand why or how this could be the case, but I contemplated the results and developed a hypothesis. Well-Hit parameters essentially cancel out any mishits. Perhaps, the best hitters in the game had fewer mishits, or “bad hits,” while less successful hitters had more mishits. If this was indeed the case, the well-hit filters might have been kinder to less successful hitters, who would have benefitted more from losing their mishits, while the data for the best hitters remained more or less the same. While I need to do more work to identify the driver behind average EV’s importance, it seems like a logical explanation for a relationship that, at least at first, seemed odd to me.
However, average EV wasn’t just the greatest predictor of offensive success. It was the greatest creator of it as well. Take a look at the bar chart below, which shows the slopes of each graph across the three time frames:
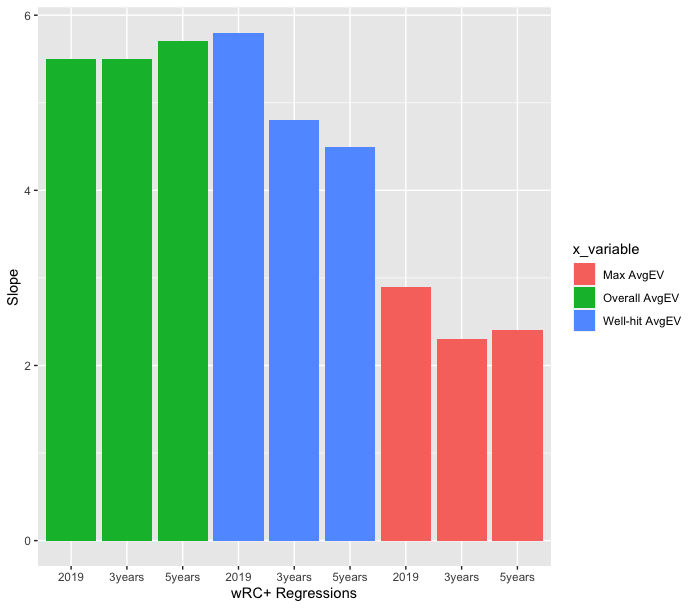
As you can see, the slope of average EV was the only one to increase over time. While well-hit EV narrowly had the largest slope in 2019, it steadily decreased over the three- and five-year periods. As for max EV, its slopes were by far the least for each period, and it also showed a lack of consistency across the time frames. Essentially, this means that every 1 MPH of average EV results in a more significant increase to wRC+ compared to each of the other two EV metrics.
Though max EV proved to be the least valuable of the three stats, I did notice one trend in the data: while a low or middling max EV has little effect on wRC+, an elite max EV seems to indicate better performance, as none of the worst performers (wRC+ < 80) had a max EV greater than 115 MPH. While it doesn’t necessarily rule out poor performance (*ahem* Nomar Mazara), max EV may point to potential in a batter—potential that, when combined with efficient mechanics, could lead to more consistency, higher average EV, and a greater wRC+.
So, what does this all mean? From a player development standpoint, players should focus on their average EV rather than their peak EV. Jason Ochart’s sage advice also happens to translate to average EV; hitting the ball hard is good; bat speed is good. Indeed, train accordingly. However, rather than selling out for max EV, focus on consistent mechanics and square contact, raising that average EV as high as possible. As the masses on Twitter drool over max EV, don’t let the hype fool you. Consistency is key.
